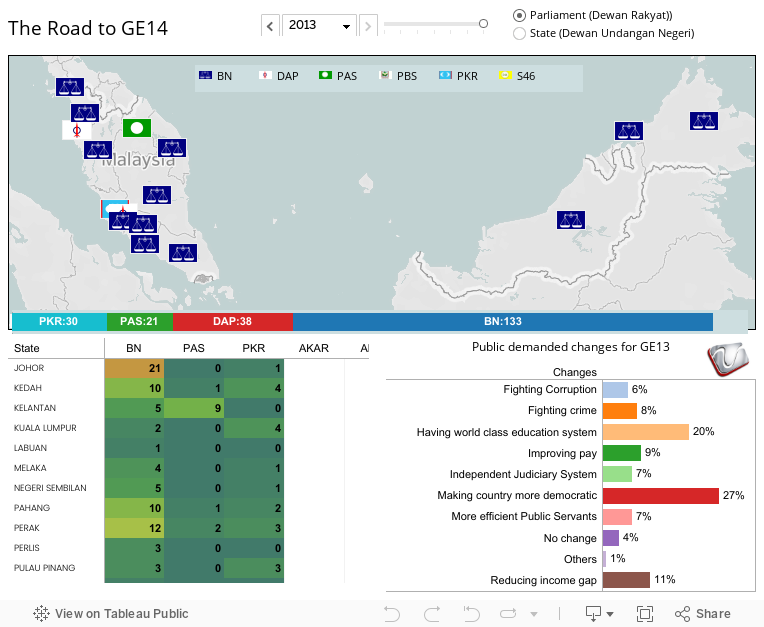
A while back I posted something about the Malaysian Political scene since 1986, and if you are aware about the Malaysian politics, finally the 13th General Election is upon is after such an agonizing wait. This GE could turn out to be a make or break deal for Malaysia especially the opposition party Pakatan Rakyat (PR) or People's Coalition, which also added some unimaginable pressure for Barisan National (BN) or the National Front, to prove their tried and tested governance of 56 years. By the time you are reading this, Malaysia's future could have unfolded as the world watch. Hopefully, you've been watching in delight as democracy is being practiced with intelligence and maturity rather than in anarchy. So crossing fingers, we only hope for the best regardless which party succeeds, we only wish that it is the people who ultimately won.
Since this is a revisit to our dear old Viz, I've upgraded it with some insights on how the Malaysia's poorest living under $5 have been doing since 1986 and also a little look at a survey on what Malaysians generally want change in their government. Also you can see that I've incorporated some cool Tableau V8 features inside.
Its interesting to see that at 2004 our nation's middle and poor class have totaled to more that 10 million, which is about a third of the people of the country, a direct impact of the 1998 financial crisis no doubt. But amazingly, the people trusted the then prime minister Tun Abdullah enough that it translated into a huge win for BN and the number of middle to poor class were lowered in 2008. So hopefully we'd see the same trend in 2013.
So pray for the best, and wish us luck on 5th May 2013. See ya.
-Zan