Here's another take of the What If? series. Today's entry is trying to figure out, of sorts, the S&P index of the top 500 publicly listed companies in the United States. For the uninitiated (like yours truly), the S&P 500 index is one of the indices that some investment companies offer as a fund, dubbed as "index fund", that you could invest your money in, these funds is bench-marked to the S&P 500 by holding the same share as the index. This index is traded daily thus hold a very large of historical data that goes back to the 1950s.
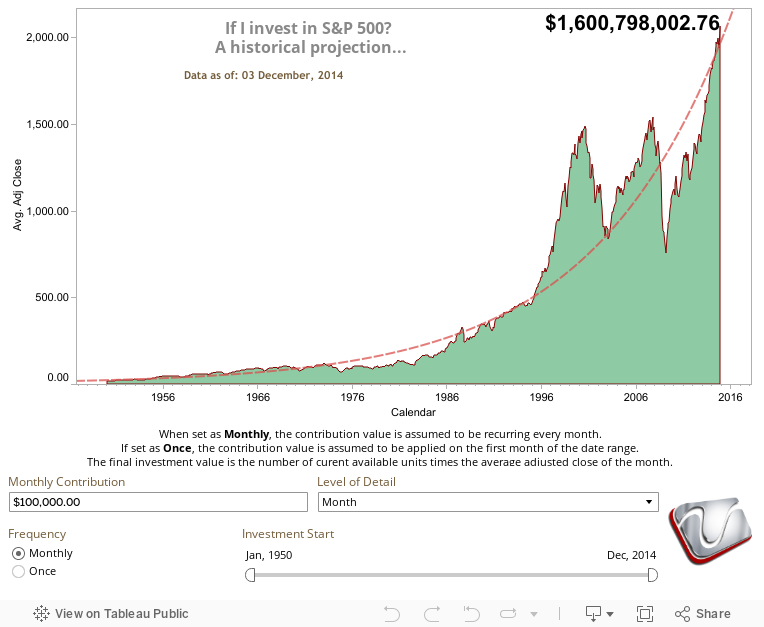
Now What If? You started to put money on these index funds and continually contribute on a monthly basis. Based on the historical prices of the Index up to the the time of upload, we have generated the Viz below to reflect on the potential of profit, as well as show the behavior of the index for the past 50 plus years. Imagine contributing money since the 80's or 60's or the 50's, how much your wealth would have grown.
The Data below is provided by Yahoo! Finance and generated with Tableau.
Edit: Updated our Viz with Tableau 8, and added some new calculations and controls :)
-Zan
Hover your mouse on the graph to get more info

No comments:
Post a Comment
We value your comments...